Call Analysis Report – How It Works
The Call Analysis report helps you understand how your care home handles phone calls and where you can improve.
It is split into clear sections that build on each other, so you can go from a quick overview to more detailed insights.
What You’ll See
- Overall call activity – how many calls you receive
- Performance metrics – how well calls are answered and handled
- Care enquiry insights – how effectively you manage potential resident enquiries
- Benchmarking – how your performance compares to other care homes
Why It’s Useful
The report doesn’t just show how many calls you get. It helps you understand:
- What happens to those calls
- How quickly and effectively they are answered
- Where you may be missing opportunities
- How you compare to other providers
Overview Section
The Overview section gives you a quick summary of your call activity.
The Headlines tab is the starting point. It shows:
- Total number of calls
- Calls broken down by location (if you have more than one home)
- Care enquiry calls, so you can quickly see demand from potential residents
Summary Tab
The Summary tab builds on this by showing the same information over time.
This helps you:
- Spot trends in call volumes
- See if calls are increasing or decreasing
- Understand how performance changes over different periods
The numbers in both tabs match, so you can easily switch between a quick overview and a more detailed view.
Care Enquiry Voicemails
If a voicemail is confirmed as a care enquiry, it is included in your enquiry data.
This ensures you still capture important opportunities, even if the call wasn’t answered.
.png)
.png)
Call Answering Performance
This section helps you understand how well your team is handling incoming calls.
Call Answer Rate
The Call Answer Rate shows the percentage of calls where someone speaks to a real person.
- Answered calls – calls picked up by your team
- Voicemails – messages left by callers
- Missed calls – calls that were not answered
Voicemails are not counted as “answered”, as they don’t involve a live conversation.
The totals in this section match what you see on your main report, so everything stays consistent.
Why This Matters
This section doesn’t just show a percentage — it also shows the number of calls behind it.
This helps you understand:
- If you have enough staff to handle calls
- Whether busy periods are affecting performance
- If changes to your phone setup are working
Your Call Answer Rate is also used in the Benchmarking section, so you can compare your performance with other care homes.
.png)
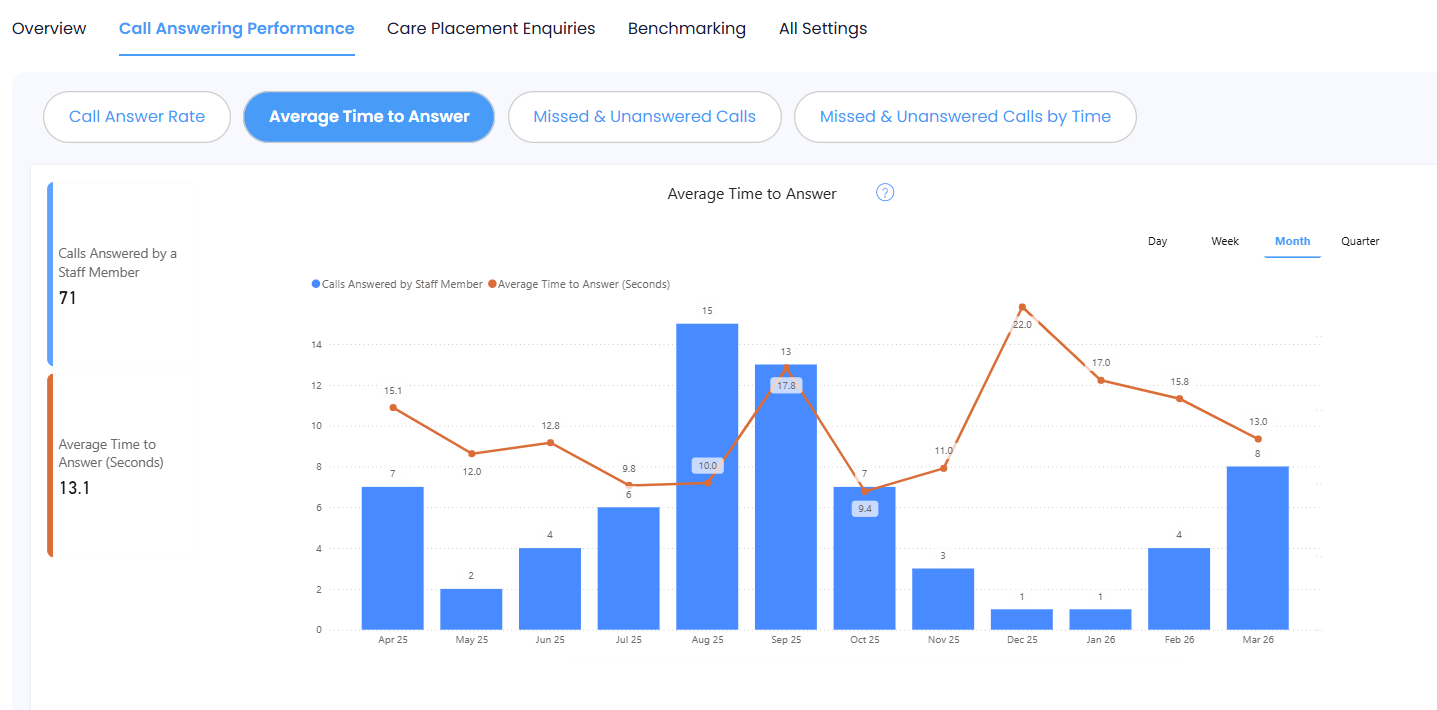
Average Time to Answer
This section shows how long it takes for someone to answer a call.
It measures the time from when the phone starts ringing to when a caller speaks to a member of your team.
Why This Matters
This helps you understand the experience callers have when trying to reach you.
Looking at this alongside your call numbers gives useful context. For example:
- A longer wait time may be expected during very busy periods
- Shorter wait times may show your team is able to respond quickly
How to Use It
This metric supports your Benchmarking results by helping you understand why your performance looks the way it does.
It gives you a clearer picture of what’s happening day-to-day, so you can make informed improvements.
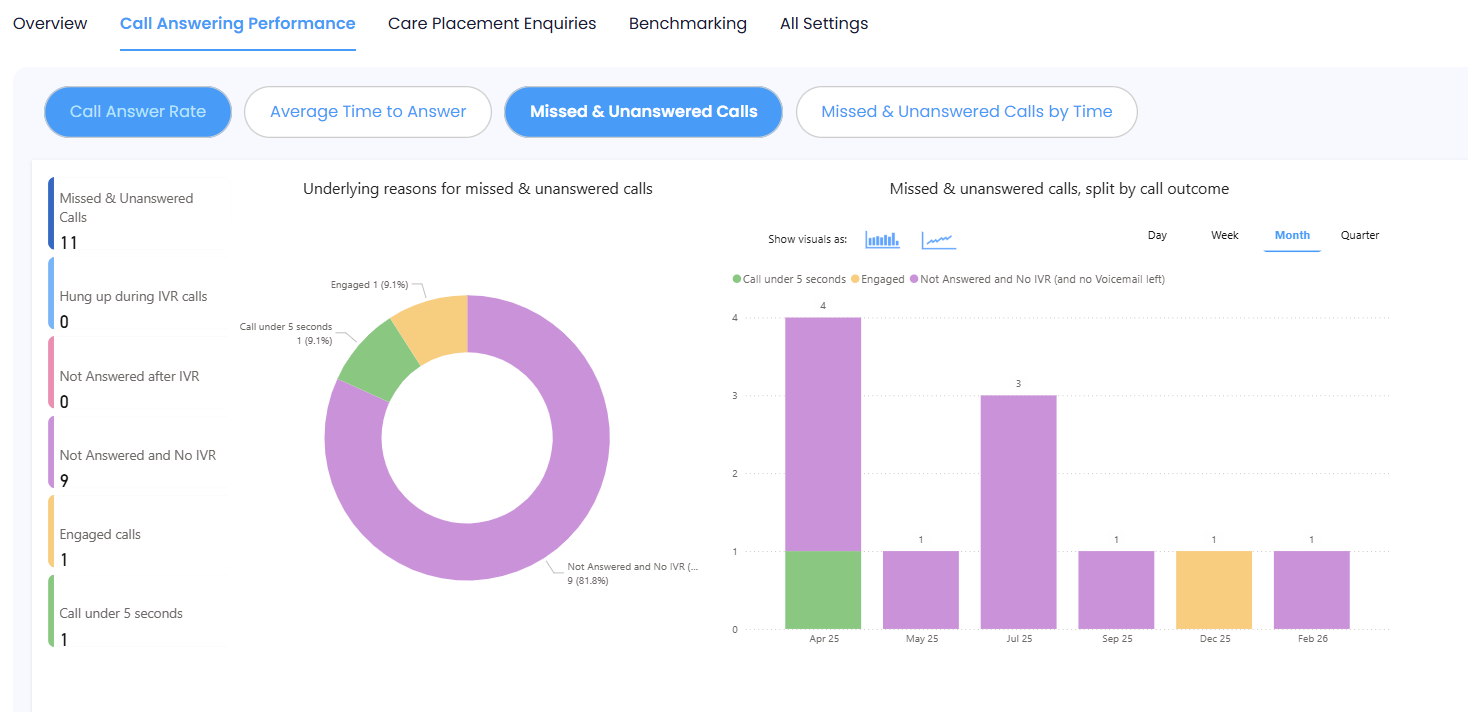
Missed and Unanswered Calls
This section helps you understand why calls are not being answered.
Instead of just showing how many calls were missed, it breaks them down into reasons, such as:
- Callers hanging up during the phone menu (IVR)
- Lines being busy
- Calls not being answered
Why This Matters
This helps you identify what might be causing missed calls and where you can improve.
For example:
- If many callers drop off during the menu, it may be too long or confusing
- If lines are often busy, your team may be tied up on other calls or you may need more support
How to Use It
This section gives you a clearer picture of what’s going wrong, so you can take action.
It also supports your Call Answer Rate and Benchmarking results by helping explain any lower performance.
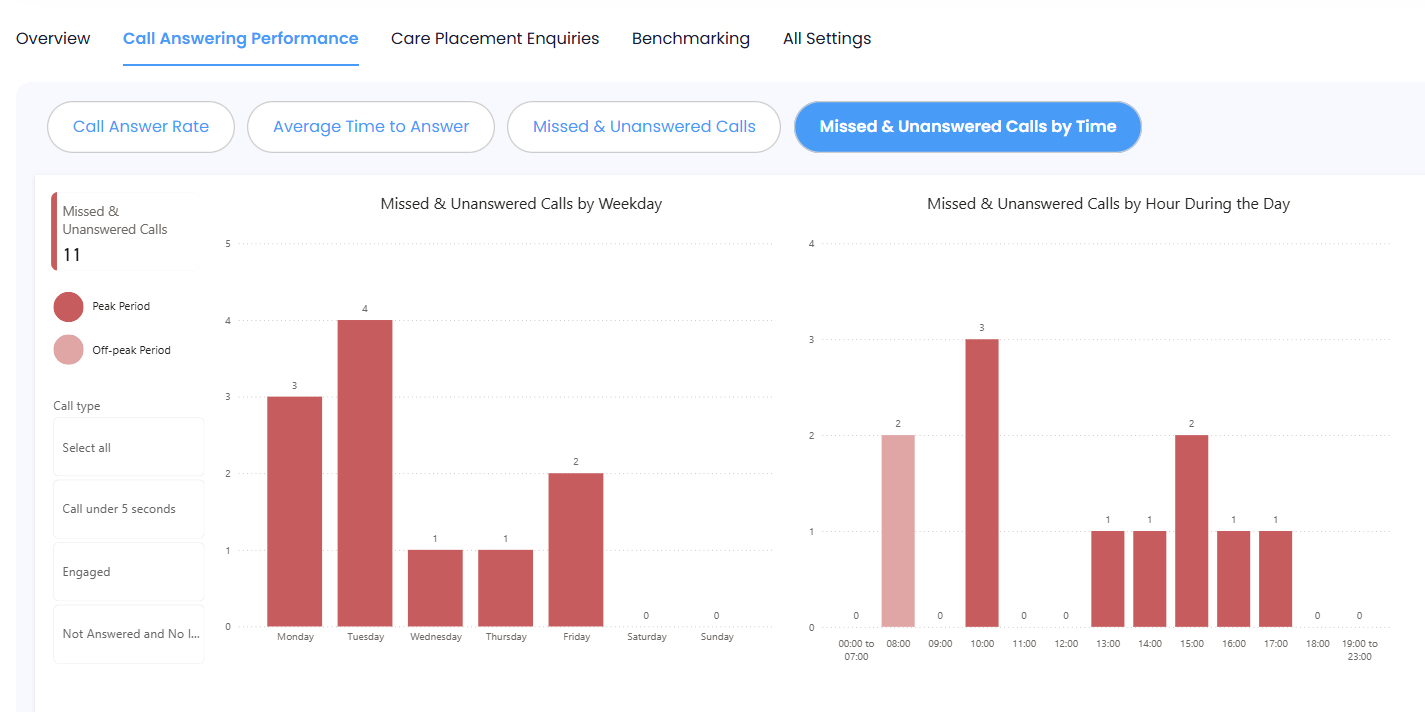
Missed and Unanswered Calls by Time
This section shows when missed and unanswered calls are happening.
You can see:
- Which days of the week are busiest
- What times of day you miss the most calls
Why This Matters
This helps you understand your busiest periods and when you may need more support.
For example:
- You may notice more missed calls at certain times of day
- Some days may be consistently busier than others
How to Use It
Use this information to plan your staffing and make sure you have enough cover during peak times.
This can help you answer more calls and avoid missing important enquiries.
Care Placement Enquiries (CPE)
This section focuses on care enquiry calls only, separating them from general calls.
This helps you understand how well you are handling enquiries from potential residents.
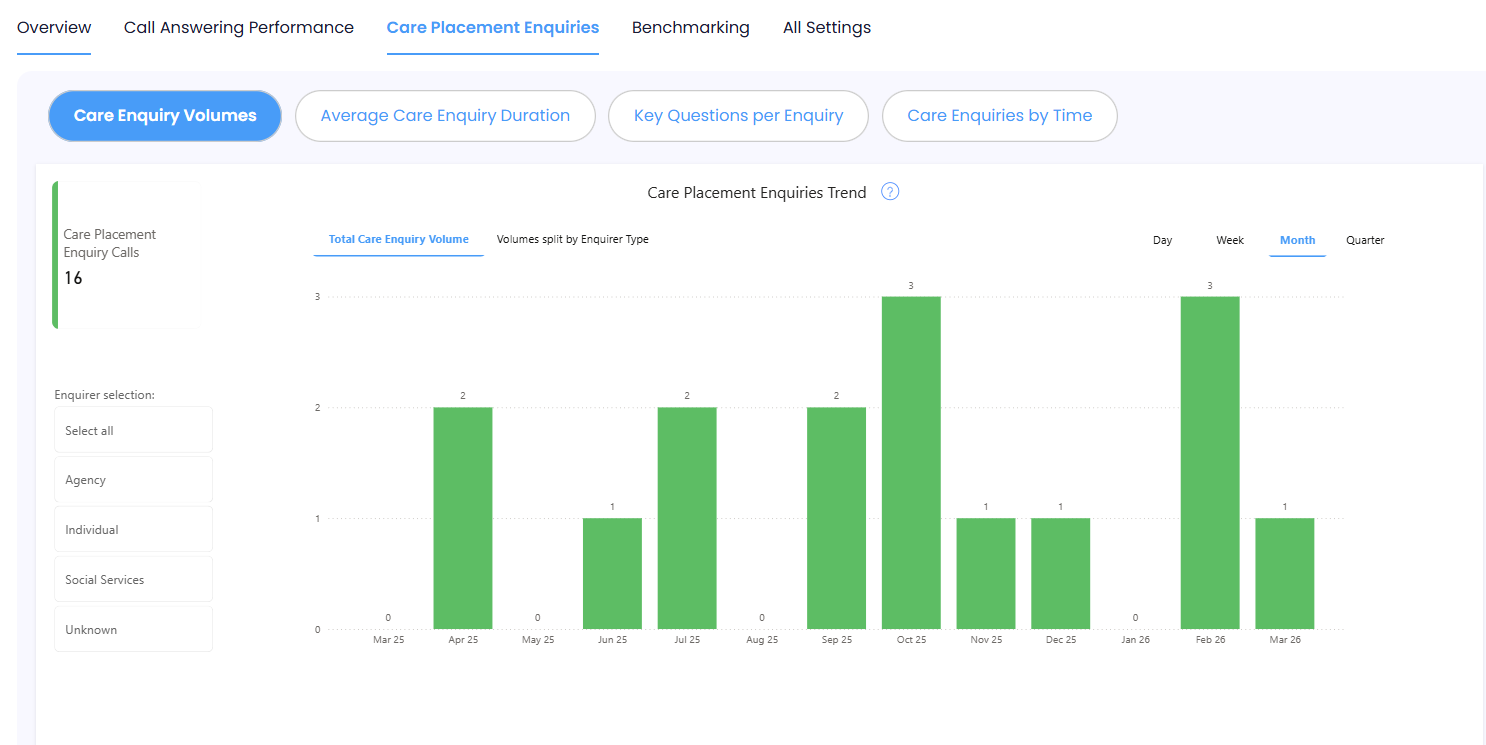
Care Enquiry Volumes
This tab shows the total number of care enquiry calls and breaks them down by who is calling, such as:
- Individuals or families
- Agencies
- Hospital discharge teams
- Social services
Why This Matters
This helps you see:
- Where your enquiries are coming from
- Which types of callers contact you most often
- How demand is spread across different sources
How to Use It
Understanding who is contacting you can help you tailor your approach and make sure you’re responding effectively to each type of enquiry.
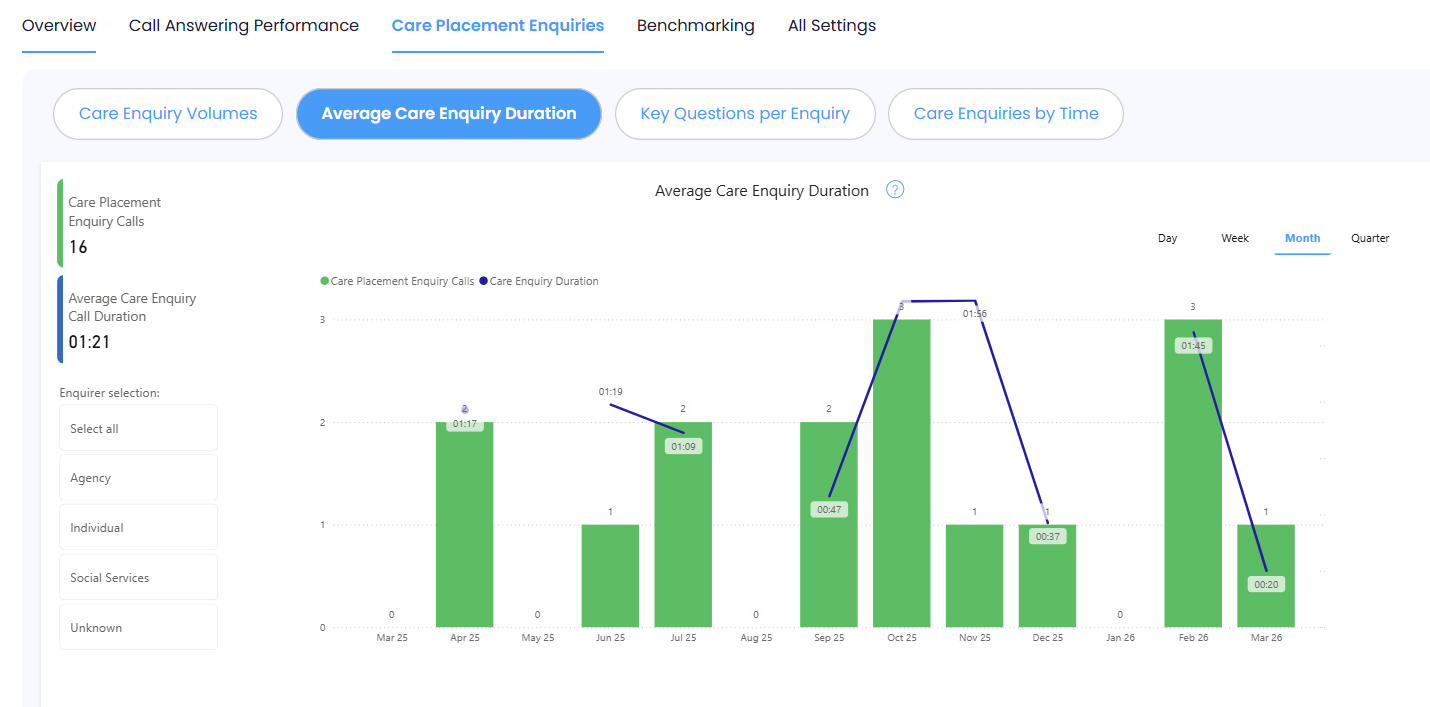
Average Care Enquiry Duration
This section shows how long your care enquiry calls usually last.
It looks at the number of enquiry calls alongside the average length of those calls.
Why This Matters
Call length can give an idea of how detailed your conversations are.
- Longer calls may mean more information is being gathered
- Very short calls may suggest missed opportunities or incomplete conversations
How to Use It
This metric supports your Benchmarking results by helping you understand the quality of your enquiry calls.
Use it alongside other data to see where you might improve how enquiries are handled.
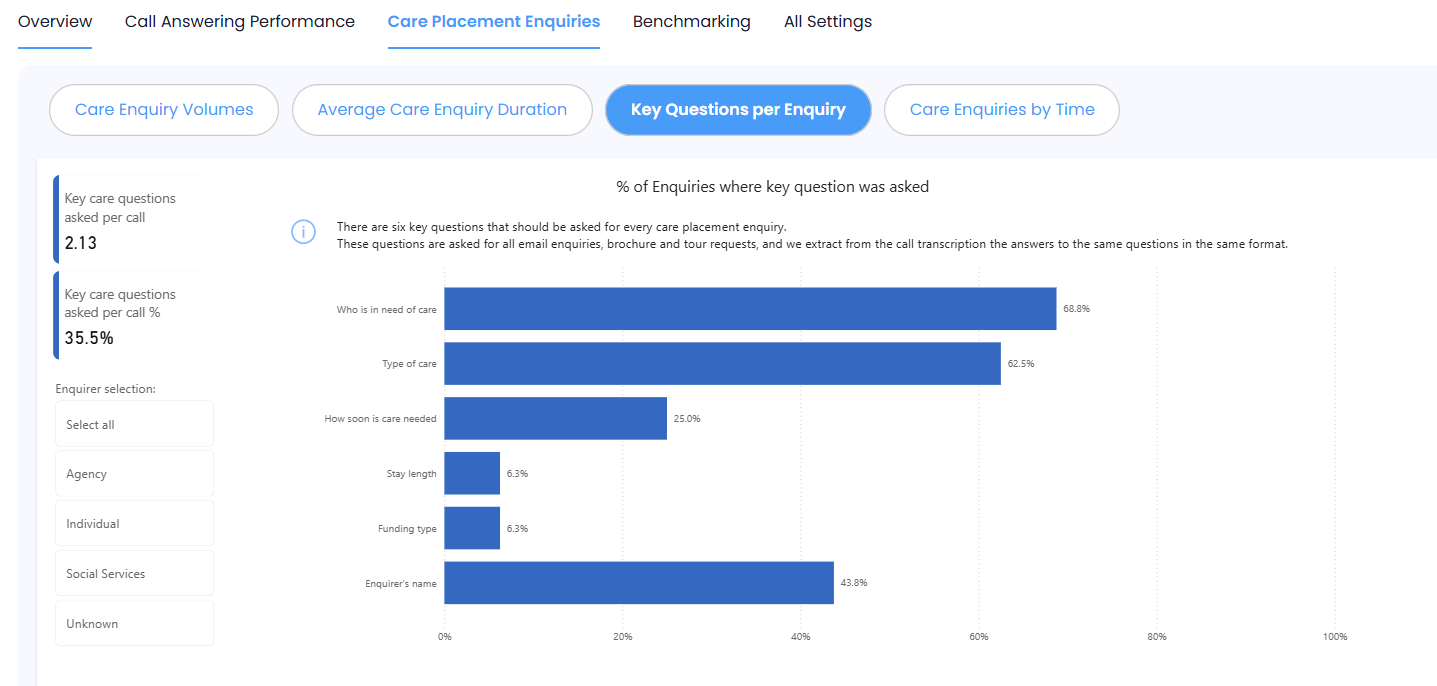
Key Questions per Enquiry
This section shows how consistently your team is asking important questions during enquiry calls.
These questions help you understand the needs of the person looking for care and collect the right contact details.
Why This Matters
Asking the right questions helps you:
- Understand if you can meet the person’s needs
- Pass information to the right team members
- Follow up enquiries more effectively
The more consistently these questions are asked, the better your chances of turning enquiries into residents.
How to Use It
This section supports your Benchmarking results by showing how enquiry quality affects performance.
Use it to identify where your team could ask more or better questions to improve outcomes.
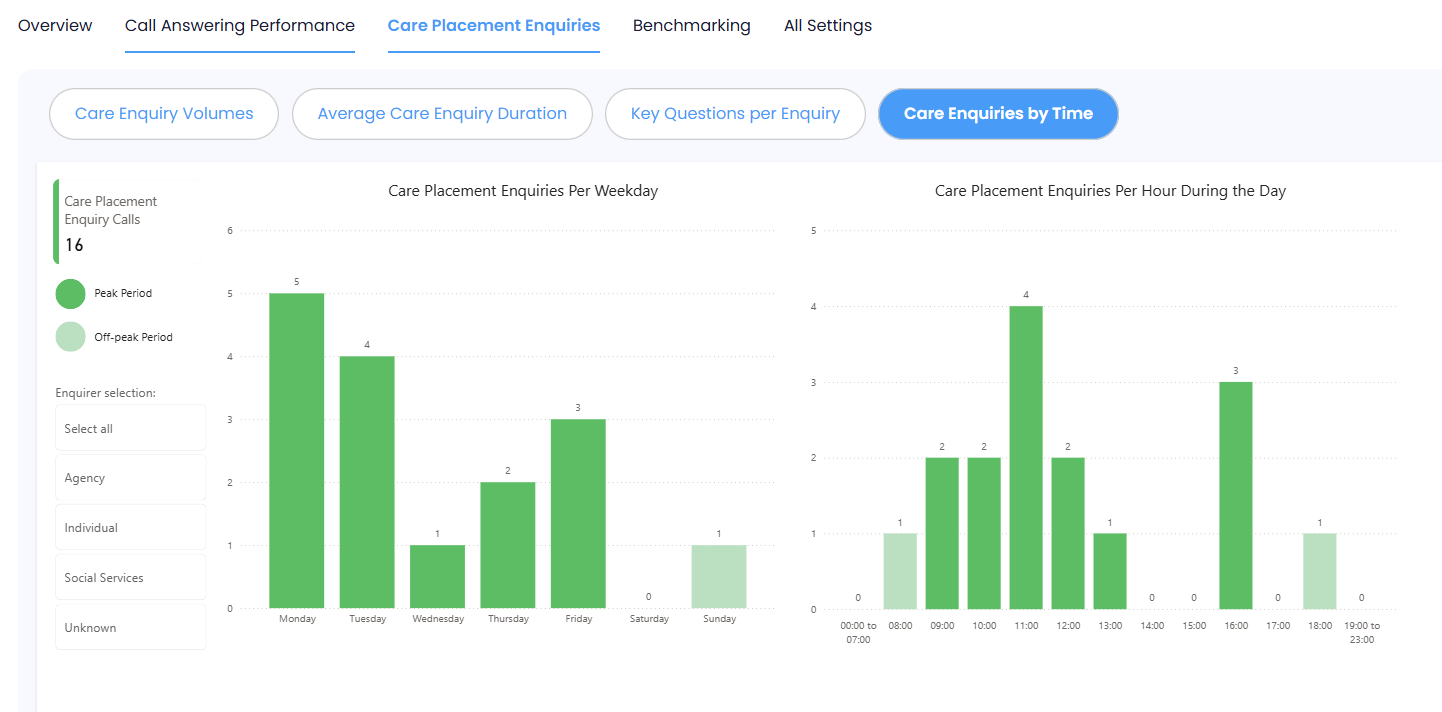
Time Intelligence (Care Placement Enquiries)
This section shows when care enquiry calls are happening.
You can see:
- Which days generate the most enquiries
- What times of day enquiries are highest
Why This Matters
This helps you understand when demand is highest, so you can be ready to respond.
How to Use It
Use this information to make sure you have the right staff available at the right times to handle new enquiries effectively.
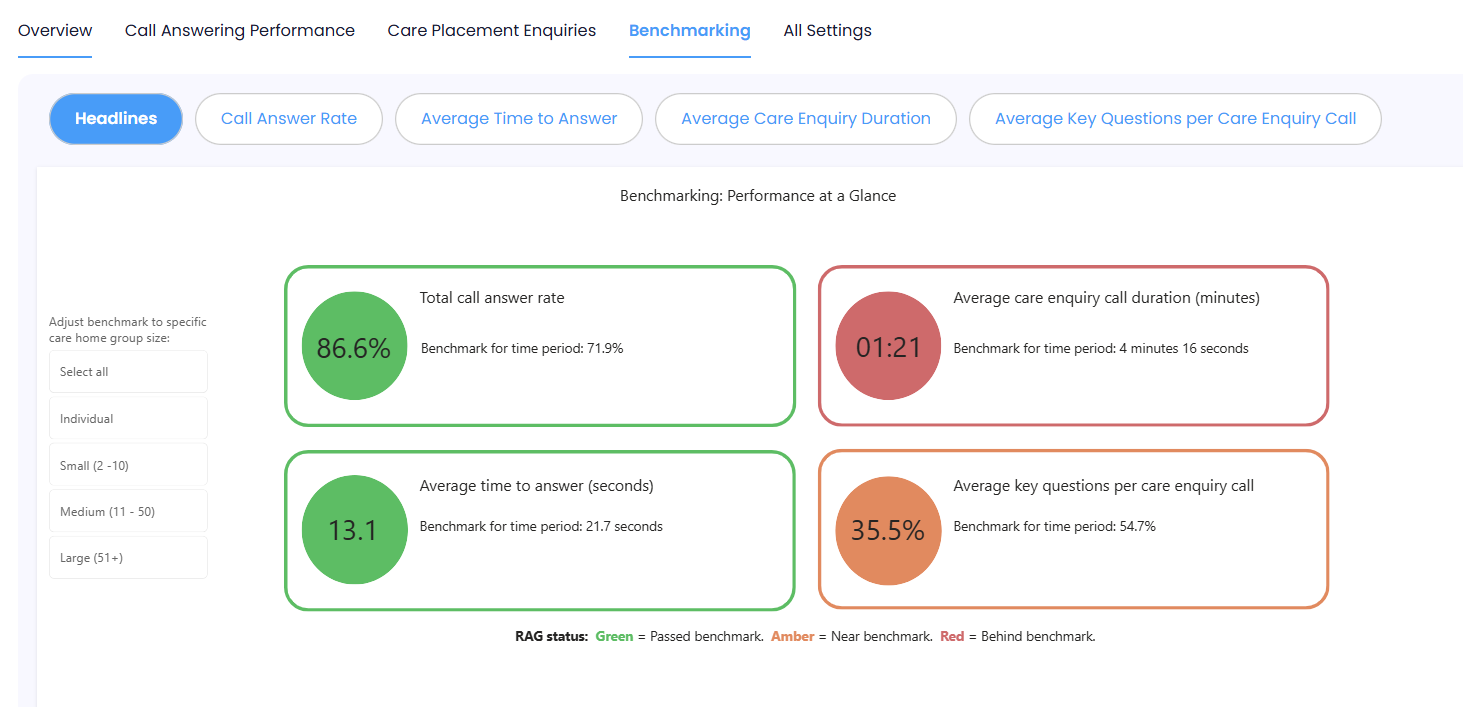
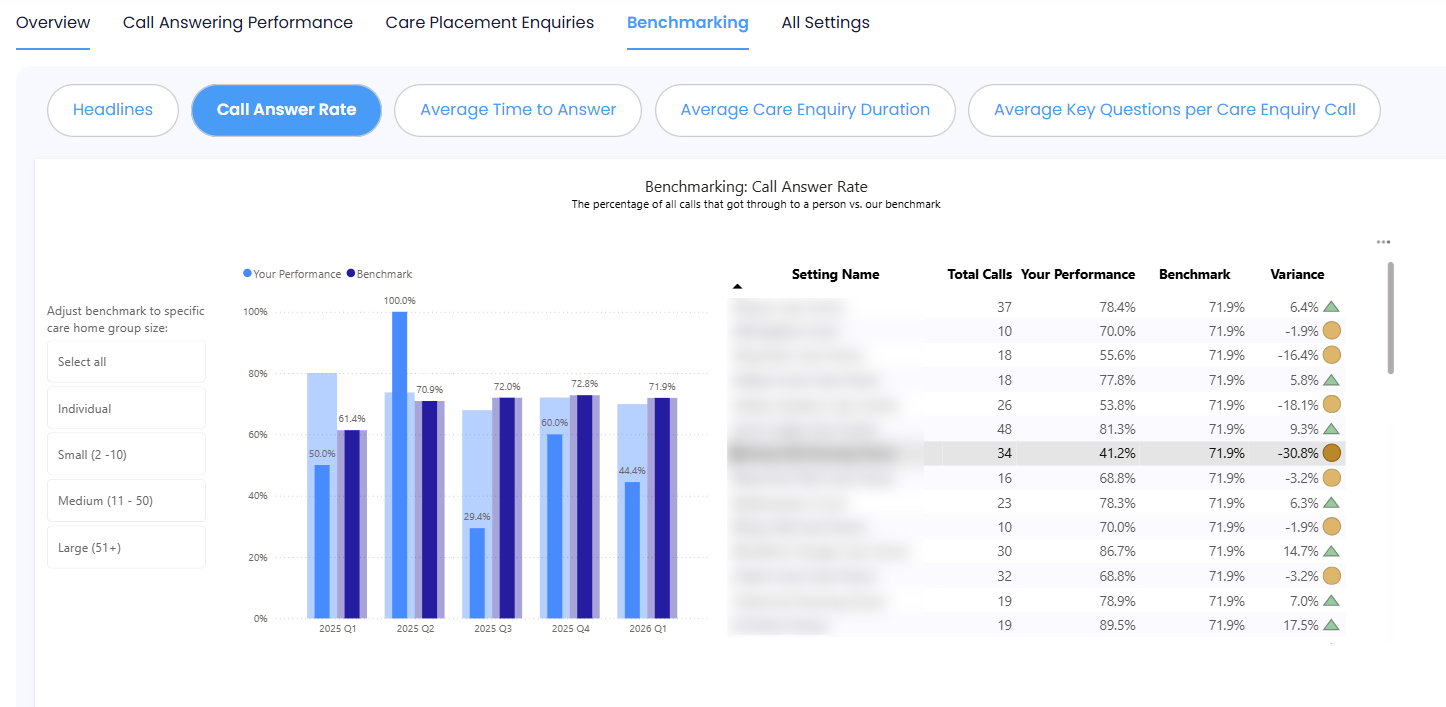
Brand New: Call Insights Benchmarking
The Benchmarking section brings together your key performance results and compares them with other care homes using Call Insights.
Headlines Tab
The Headlines tab uses simple RAG ratings (Red, Amber, Green) to show how you are performing against each benchmark.
This gives you a quick and clear view of where you’re doing well and where you may need to improve.
What the Benchmarks Show
Call Answer Rate
Shows how many calls you answer compared to the average. This includes all parts of the call journey (such as phone menus), as these affect caller experience and whether people hang up.
Average Time to Answer
Shows how long it takes for someone to answer a call. This works alongside answer rate to show how easy and quick it is for callers to reach you.
Average Care Enquiry Duration
Shows how long your enquiry calls last. Longer calls can mean more detailed conversations, but this can vary depending on who is calling (e.g. families vs. professionals). Use this alongside other data to understand call quality.
Average Key Questions per Enquiry
Shows how many important questions are asked during enquiry calls. These questions help you understand needs and capture contact details. Most care homes don’t ask all questions, so this is often an area to improve.
Looking in More Detail
Each benchmark can be explored further with:
- Easy-to-read graphs
- A detailed table (for groups with multiple homes)
If you manage a group of homes, you can:
- View each home’s performance individually
- Click on a home to see its data in the graph
- Sort the table to see top or lowest performers
.png)
How Everything Connects
The Benchmarking section works alongside the rest of the report.
- Call performance sections explain your answer rate and response times
- Missed calls sections show why calls may not be getting through
- Care enquiry sections show how well you handle potential residents
This means you can:
- See your overall performance
- Understand what’s driving it
- Identify where to improve
Region & Home Filters (Groups Only)
If you manage multiple homes, you can filter the report to focus on specific areas.
- Select a region (e.g. London) to view only homes in that area
.png)
- Or select specific homes, and the report will show which region they belong to
.png)
This helps you focus on the homes or areas that matter most to you.